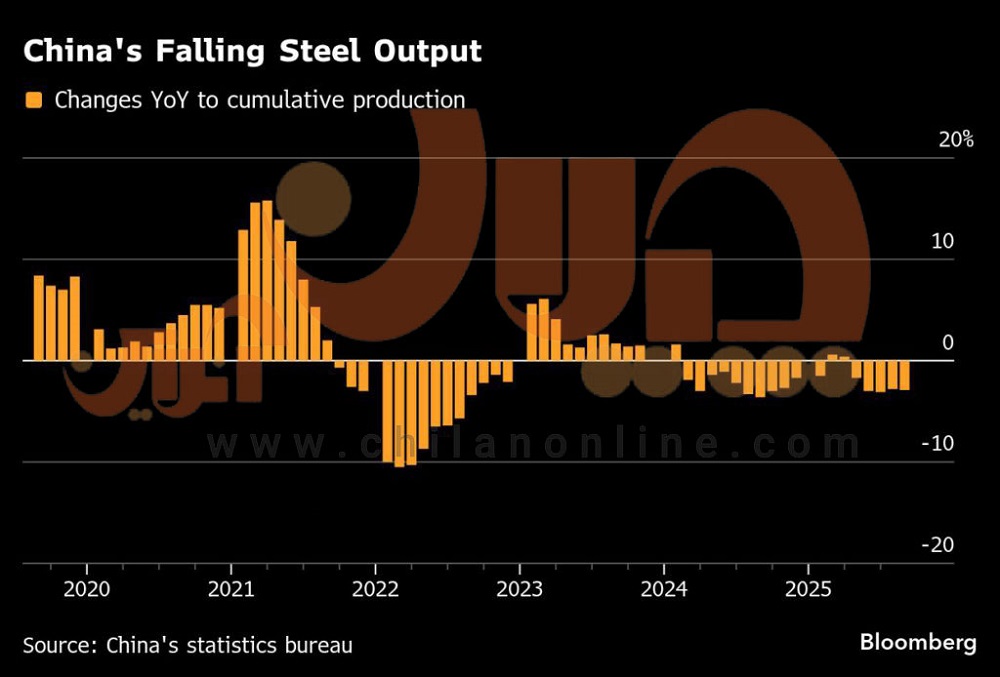
The flow chart shows the decline in China’s steel production from 2020 to 2025.
According to Chilan, Bloomberg published the following chart showing the downward trend of China’s steel production from 2020 to 2025; the bars represent the annual change in cumulative production.
The chart is based on data from the China National Bureau of Statistics.